Mission Context
As part of a European research project, I contributed to a two-month research mission conducted at the University of Tokyo, focusing on road surface friction estimation using only a forward-facing camera.
This work led to the publication of a paper, ProposalTakumi 2023 , at IEEE AIM 2023, in collaboration with the University of Tokyo and UTC. The system uses image segmentation, confidence modeling, geometric projection, and accumulation into a global surface grid map.
Demo: Video 1: Video demo: road friction estimation. .
The experiment was conducted with the Fujimoto Lab (University of Tokyo) as part of the OWheel collaboration. The laboratory specializes in autonomous vehicles and control systems, particularly for electric vehicles and in-wheel motor platforms.
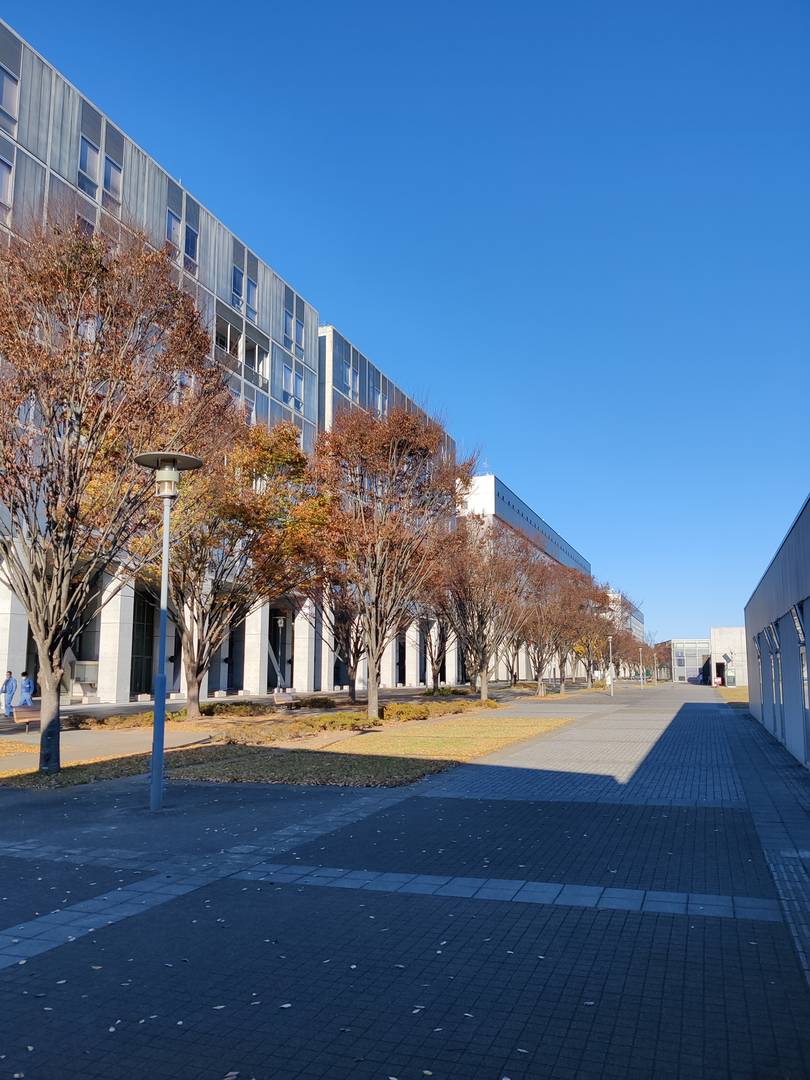
The mission aimed to detect road surface types in real time from a front-facing camera and provide this information to a traction controller.
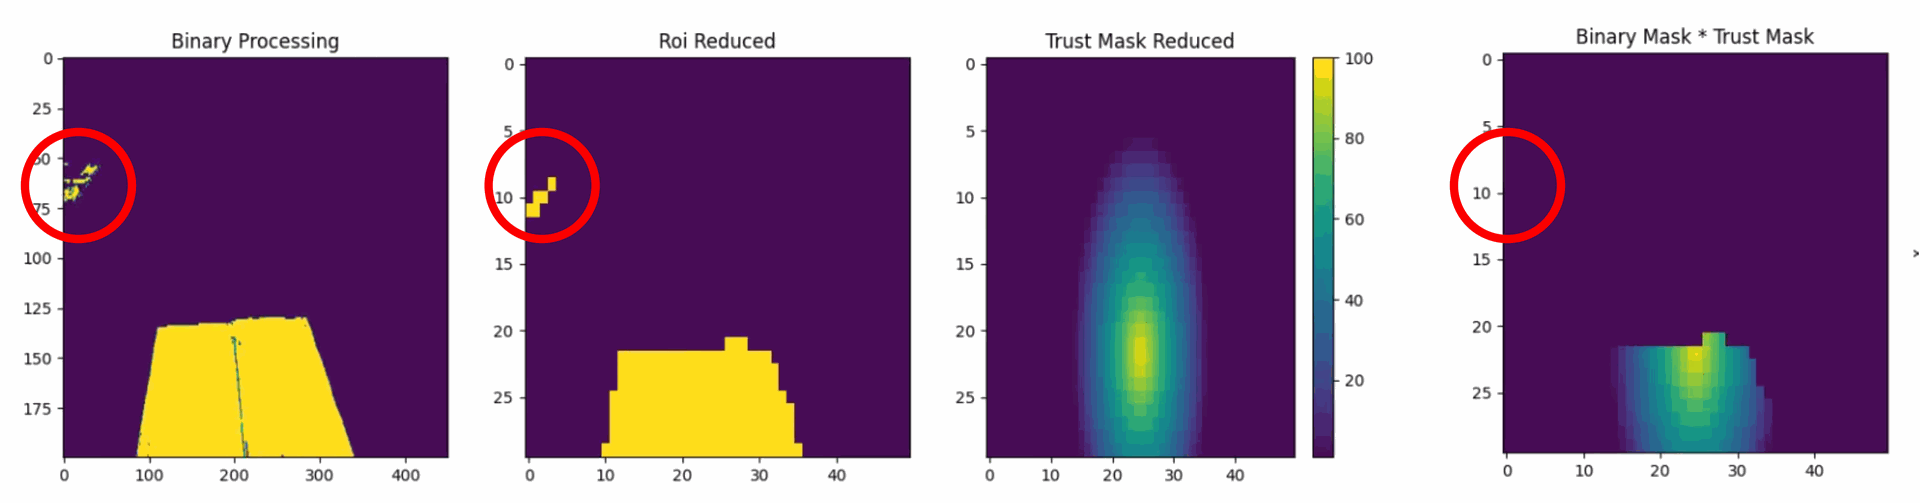
Image Processing Pipeline
Steps
- ROI selection
- Color distance computation
- Binary thresholding
- Image downsampling
- Confidence mask application
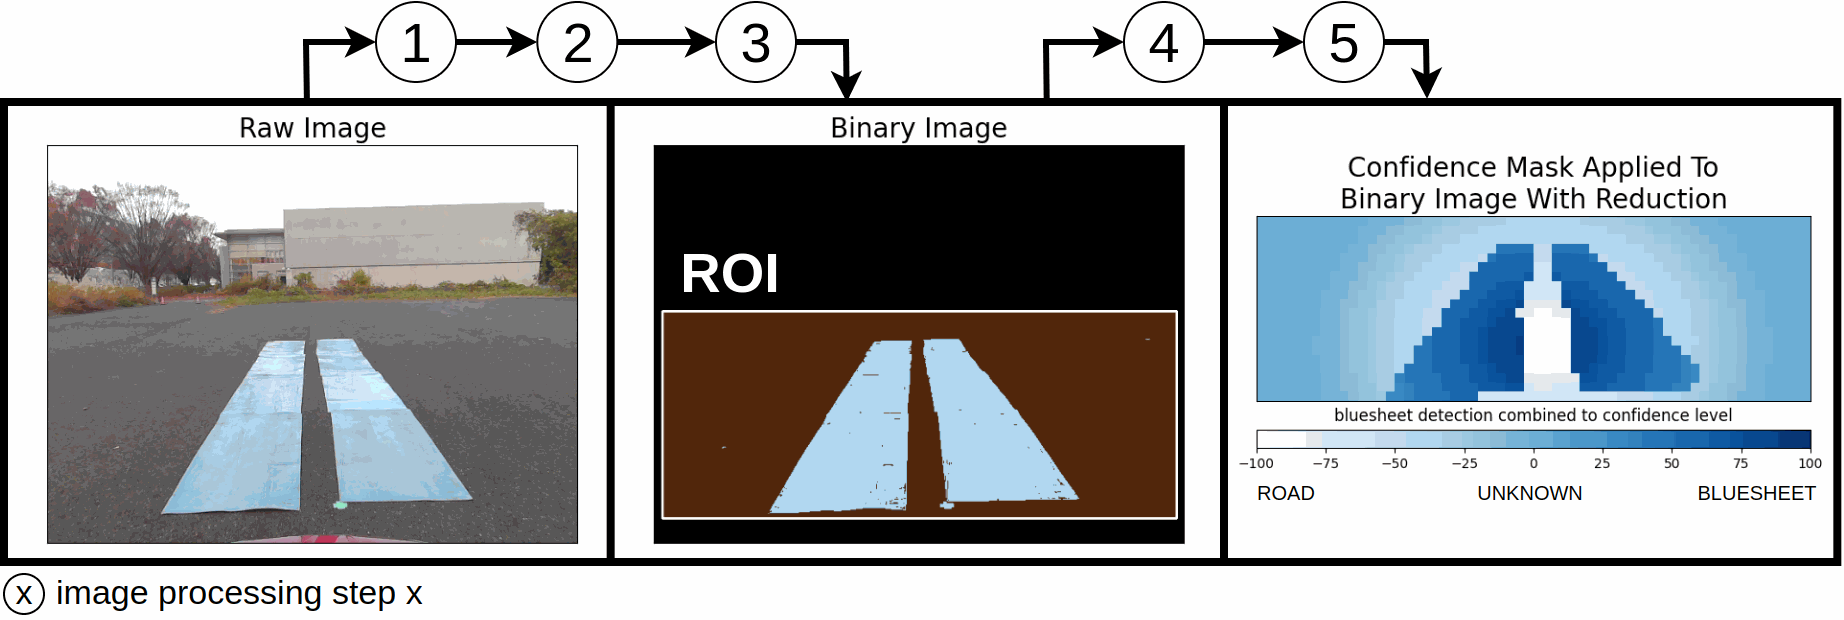
The image classifier generates:
- ROAD (normal traction)
- SLIPPERY (blue polymer)
- UNKNOWN
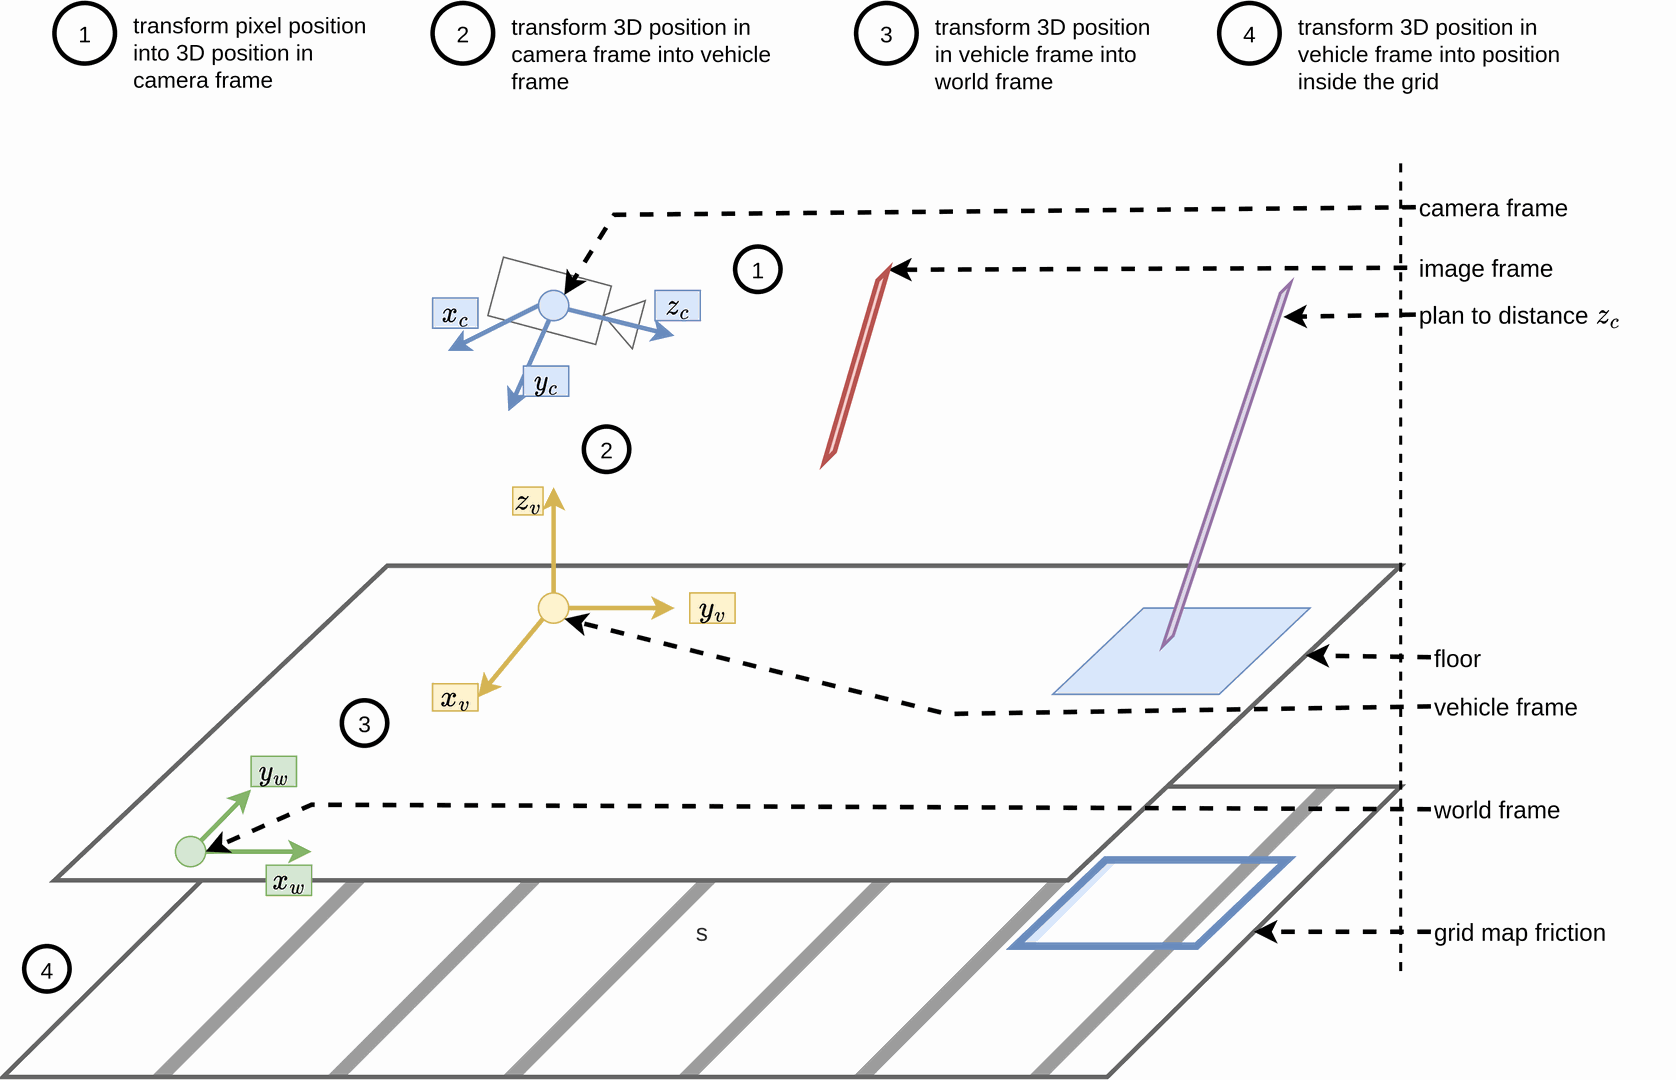
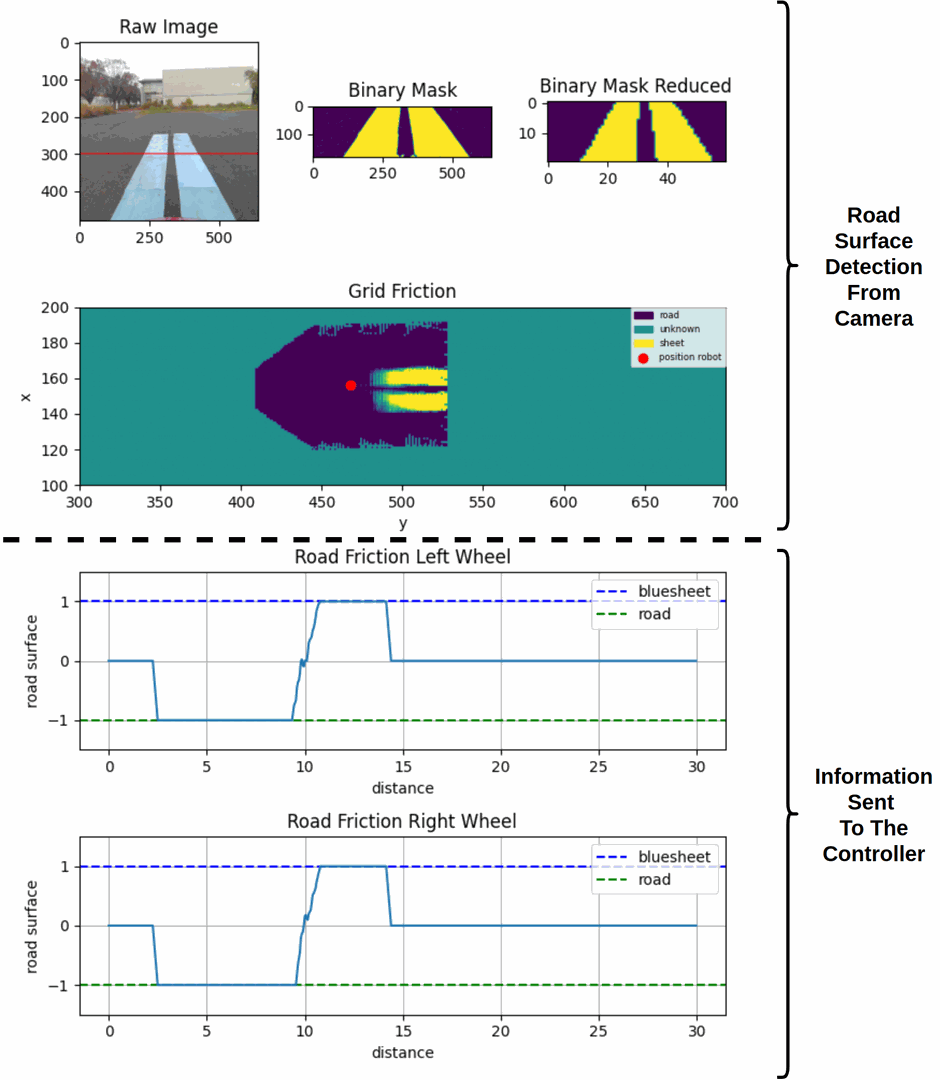
Projection and Grid Map Generation
Camera to World Projection
Each pixel $(u, v)$ is projected into 3D space using:
$$ x_c = \frac{(u - c_x)}{f_x} \cdot z(v) \quad \text{Eq (1)} $$
$$ y_c = \frac{(v - c_y)}{f_y} \cdot z(v) \quad \text{Eq (2)} $$
where $z(v)$ is the estimated distance from camera to ground, obtained via linear regression.
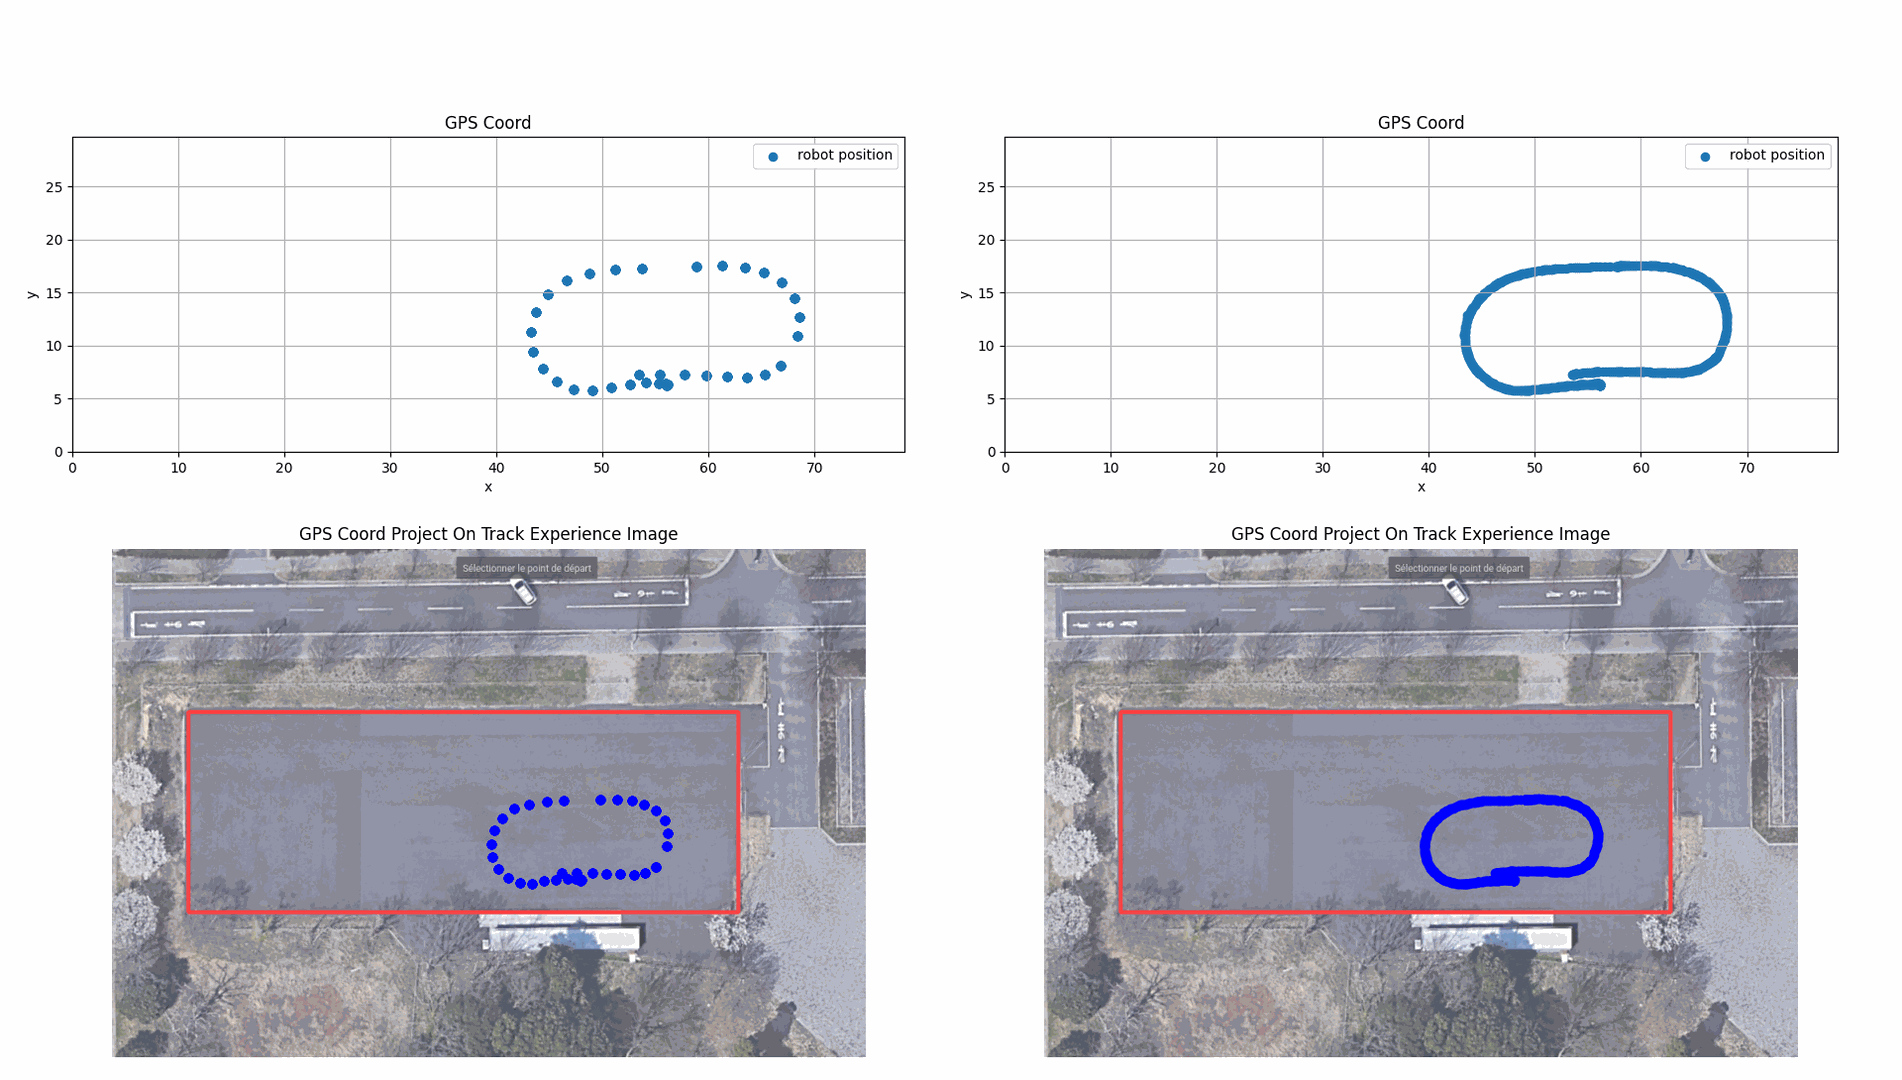
Pose correction is performed using GPS + IMU + Kalman filter to convert pixel coordinates into world coordinates for insertion into a 2D grid.
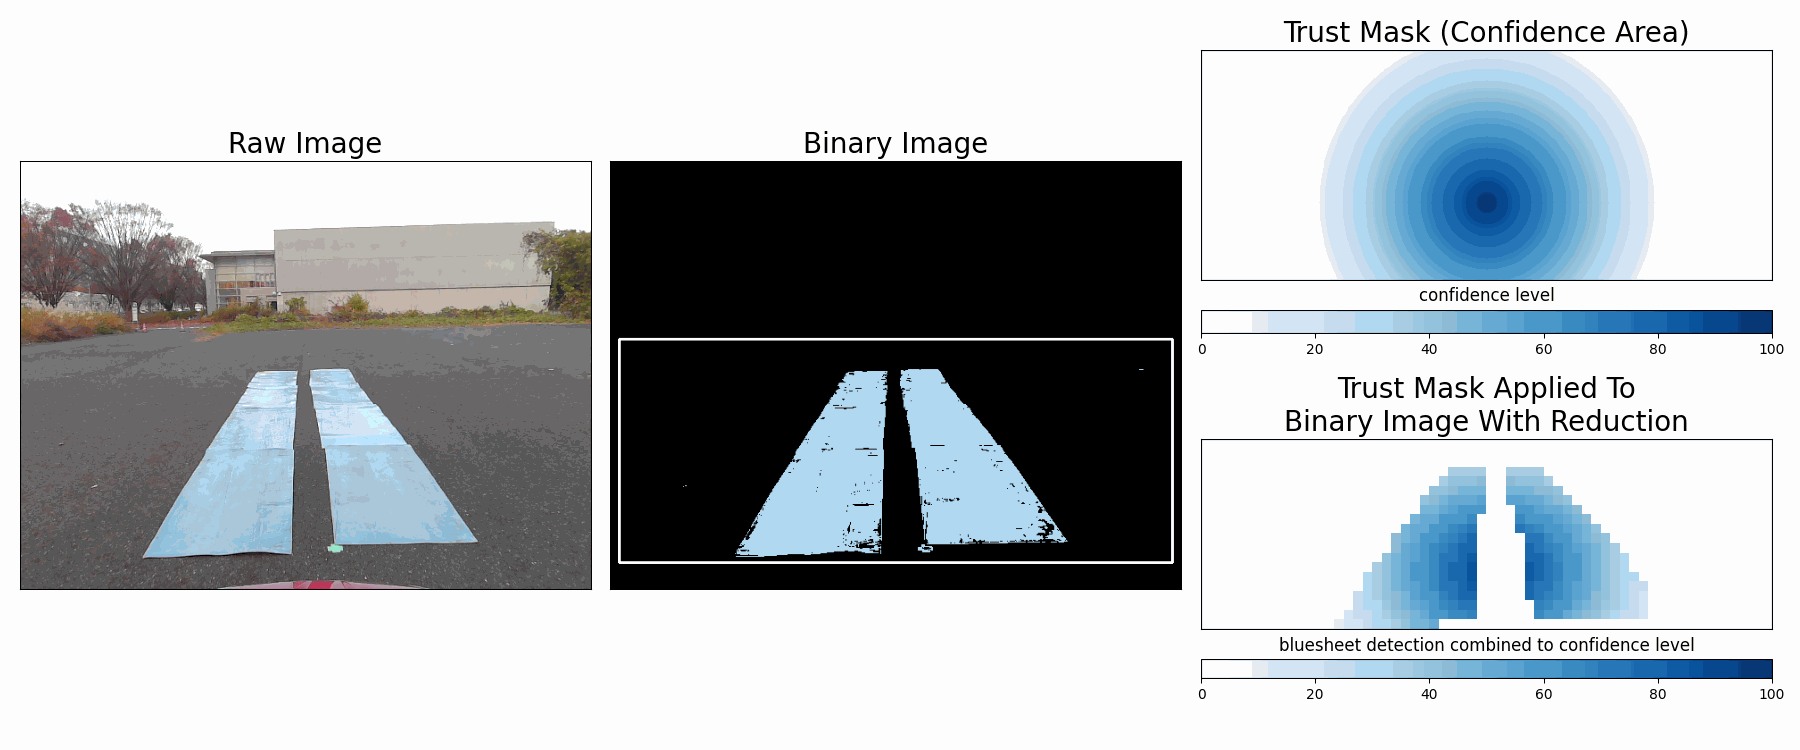
Accumulation and Trust Masking
Each grid cell is updated over multiple frames to improve stability. Confidence is reduced for distant pixels due to higher projection error and reduced color reliability.
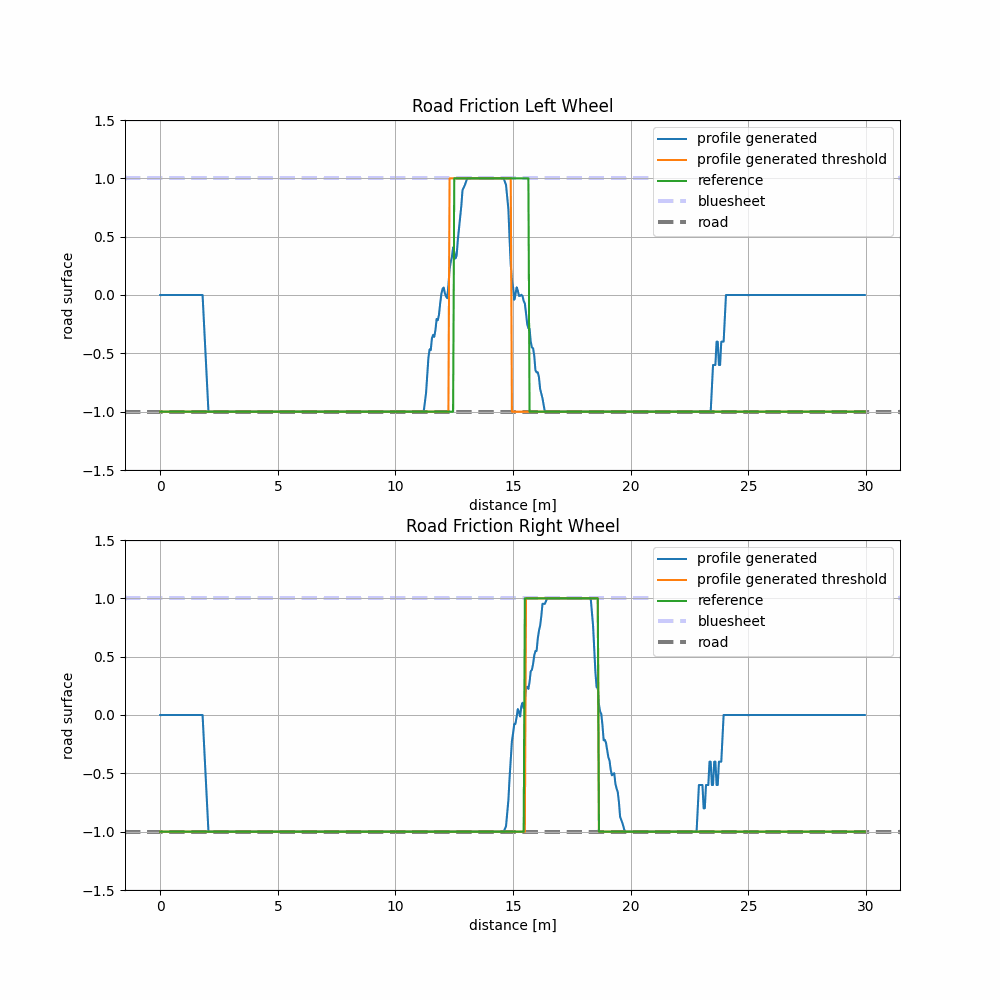
Grid Output and Road Profile
The global grid stores accumulated surface classifications over time, with two buffers:
- $B_{ij}$: slippery surface class (blue-sheet)
- $R_{ij}$: normal road class
Update rule:
$$ \begin{cases} B_{ij} \leftarrow B_{ij} + \hat{p}_{uv}, & \text{if } \hat{p}_{uv} > 0 \\ R_{ij} \leftarrow R_{ij} + \hat{p}_{uv}, & \text{if } \hat{p}_{uv} < 0 \end{cases} \quad \text{Eq (3)} $$
Final grid value:
$$ G_{ij} = \begin{cases} \frac{B_{ij} + R_{ij}}{|B_{ij}| + |R_{ij}|}, & \text{if } |B_{ij}| + |R_{ij}| \neq 0 \\ 0, & \text{else} \end{cases} \quad \text{Eq (4)} $$
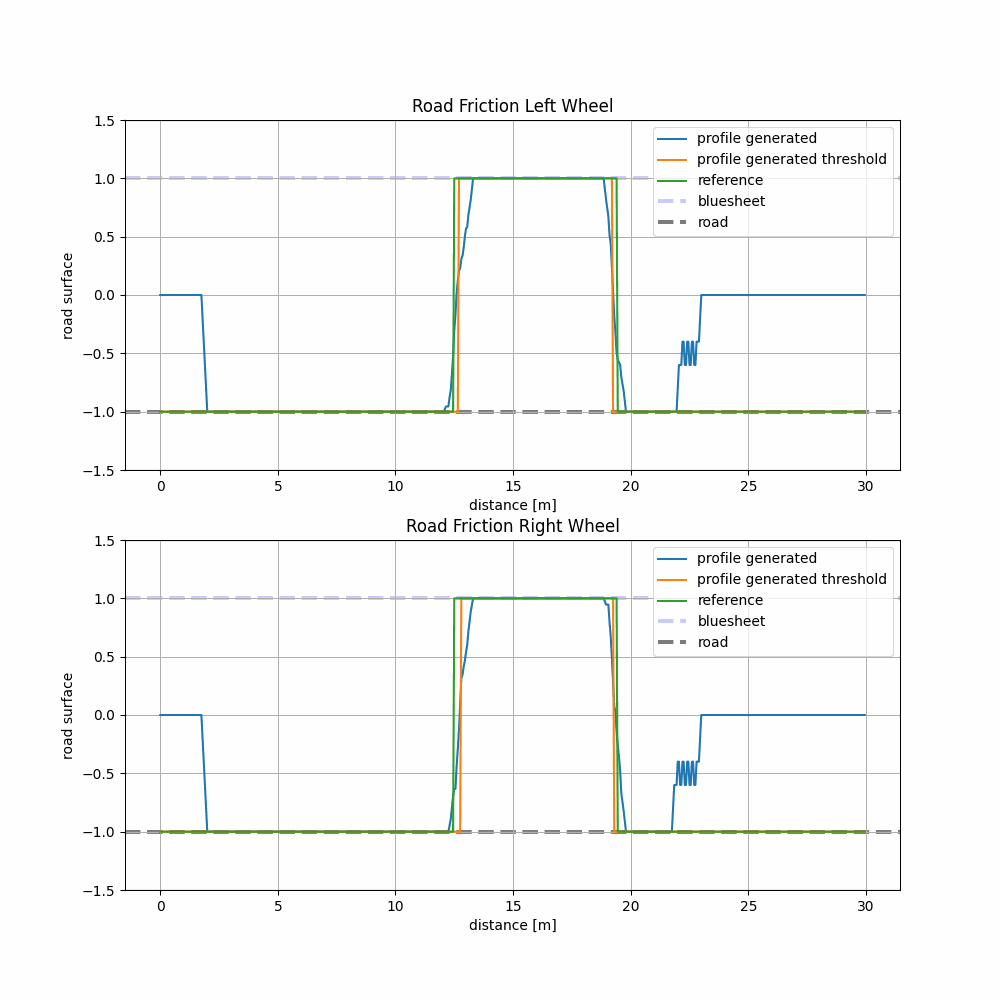
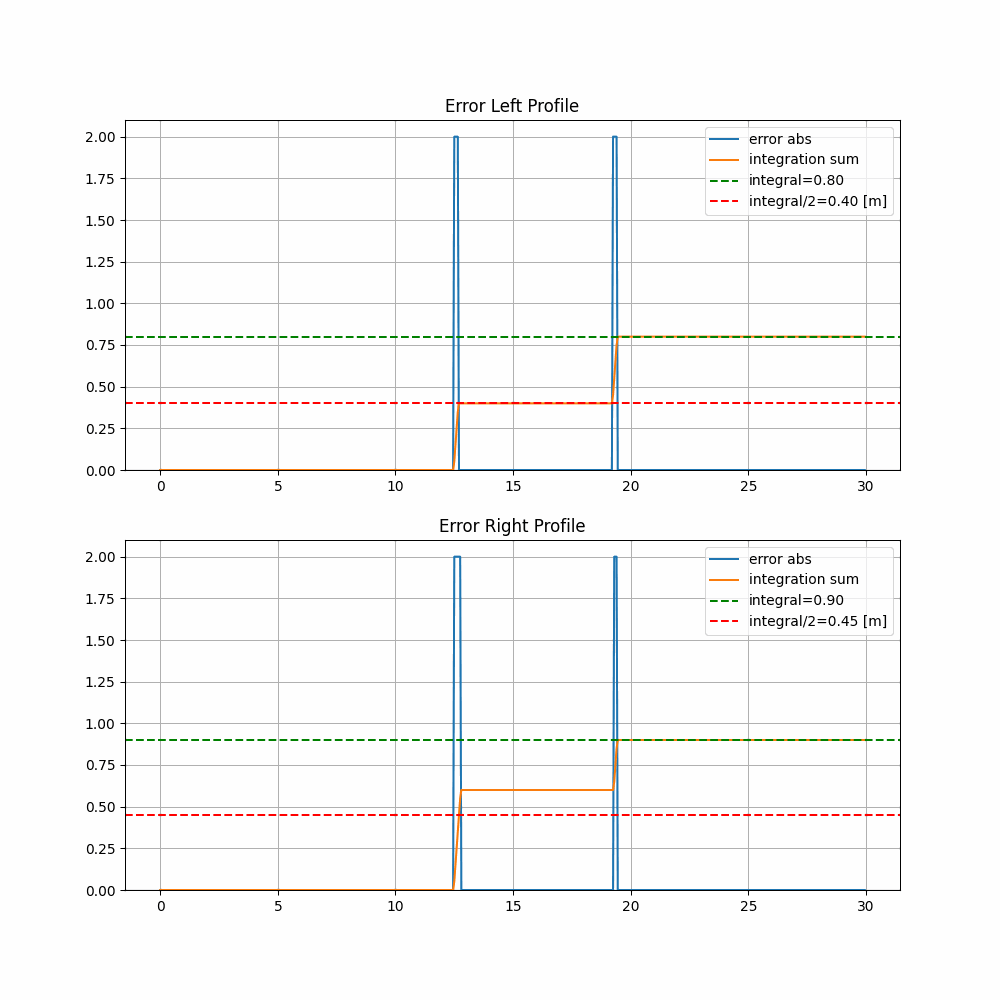
This grid is used to build friction profiles for left and right wheels.
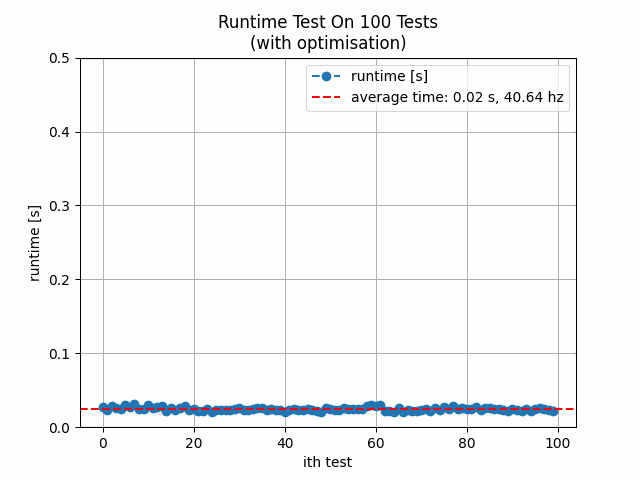
Runtime Optimization
Image resolution reduction was crucial. Projection runtime decreased by over $10\times$ when images were resized before processing.
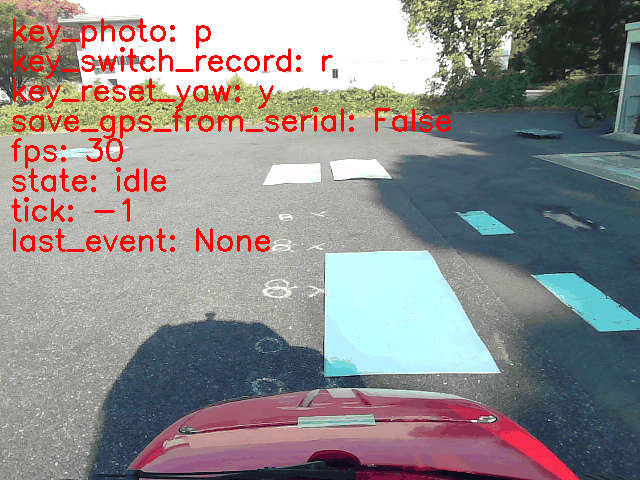
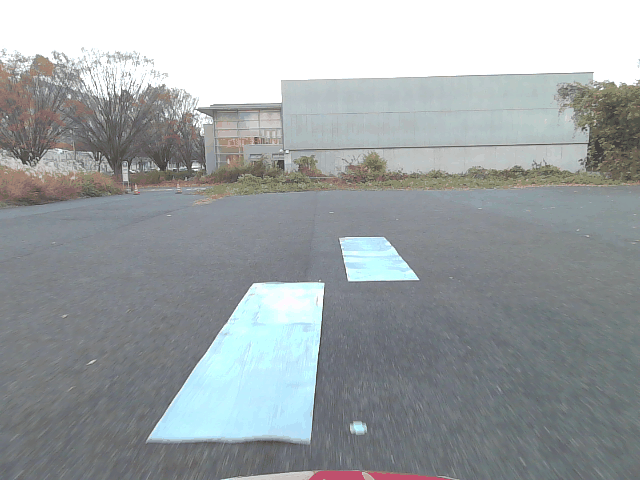
Experimental Setup
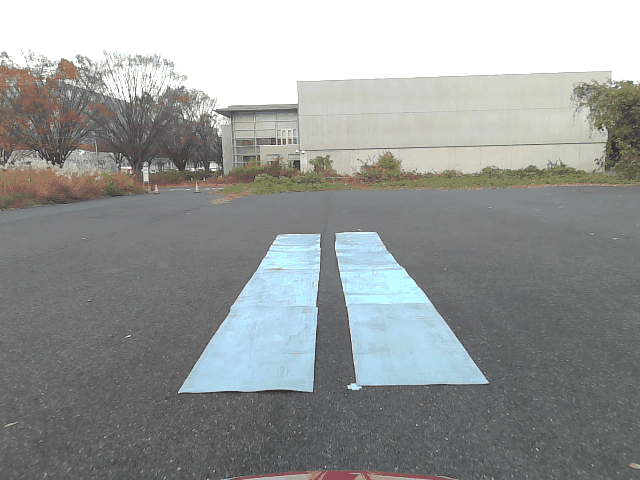
- EV testbed with onboard RGB camera and GPS
- Blue polymer simulating slippery surfaces
- Kalman filtering to improve GPS positioning
- Real-time fusion of camera and pose data
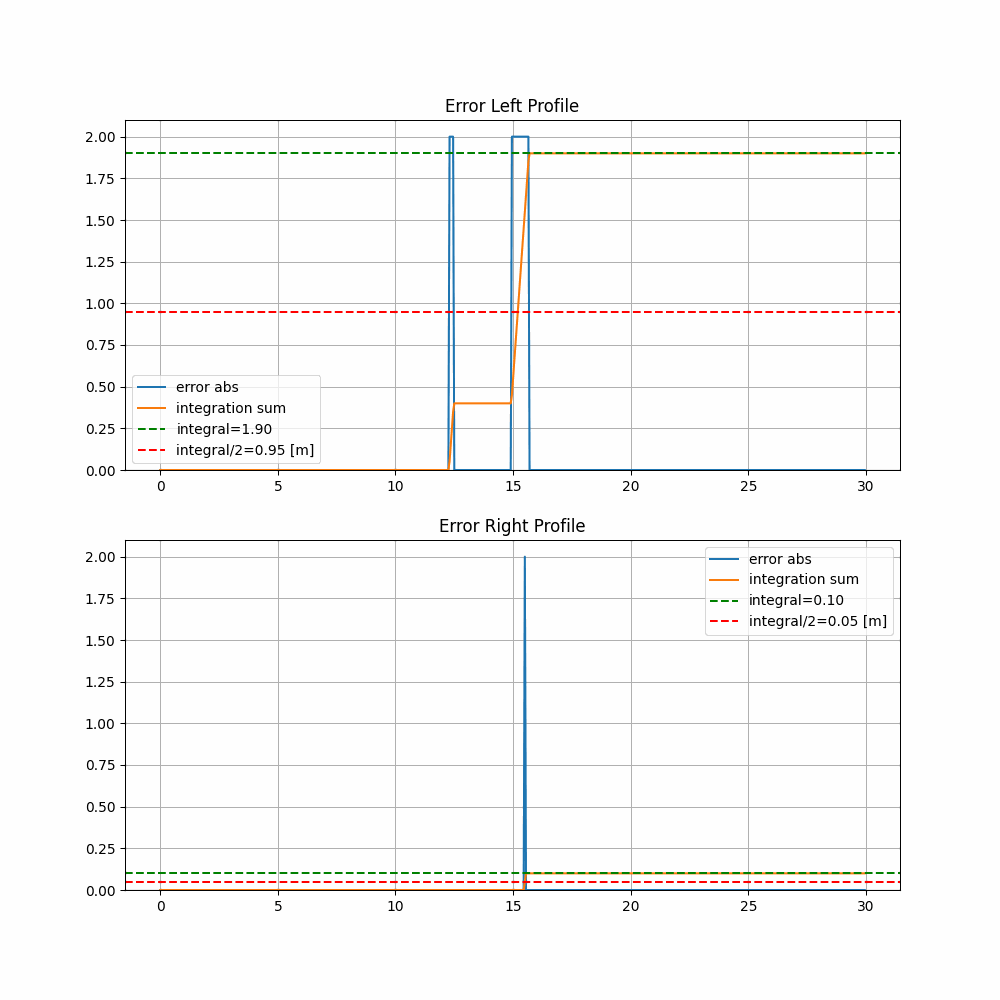
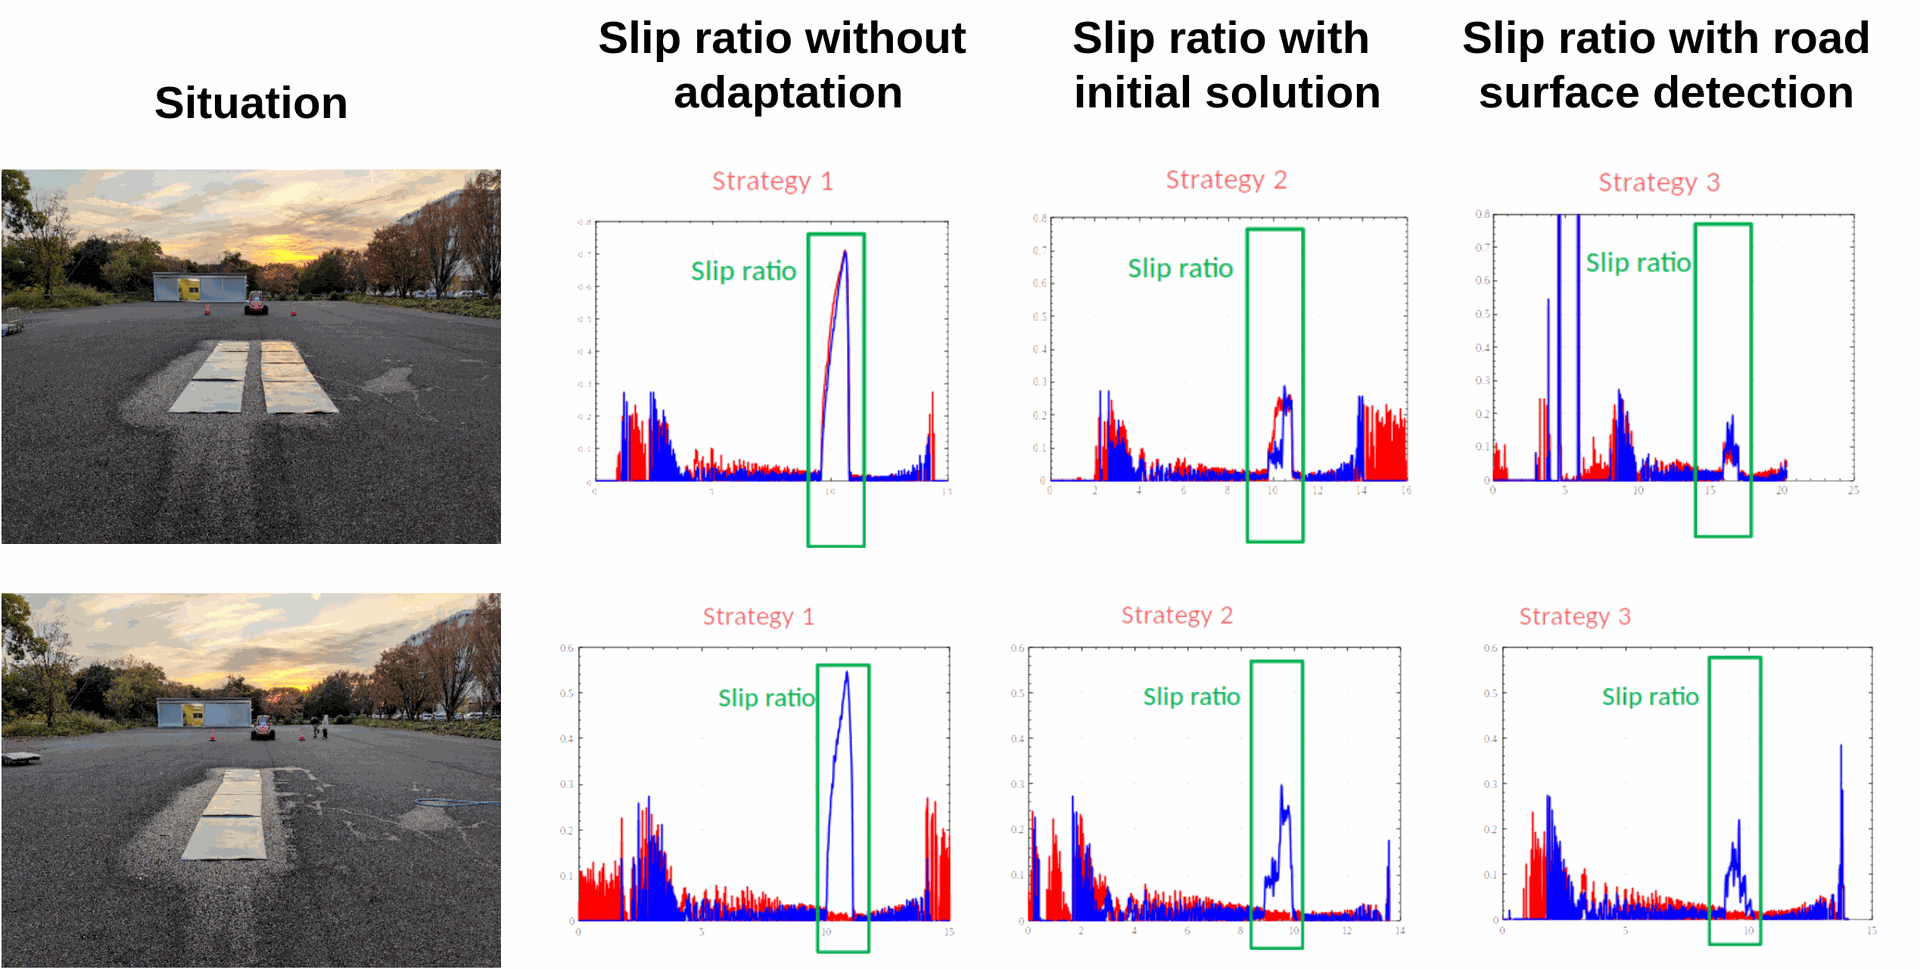
Evaluation
Case 1: Double Bluesheet Lane
Case 2: Asymmetric Surface
Slip Ratio Results
More information about control part, refer to the article ProposalTakumi 2023 .
Slip ratio is defined as:
$$ s = \frac{Rw - u}{Rw} \quad \text{Eq (5)} $$
Where:
- $Rw$: wheel speed
- $u$: vehicle forward velocity
Visual-based friction prediction reduced slip ratio by 50% compared to wheel-only estimation.
Conclusion
- Camera-based approach enables accurate real-time road surface detection
- Friction grid provides stable and reliable predictions
- System demonstrated real-time compatibility
- Traction controller performance improved with reduced slip
This confirms vision as a feasible solution for low-cost and anticipatory traction control in autonomous and semi-autonomous vehicles.
References
- Proposal of On-board Camera-Based Driving Force Control Method for Autonomous Electric Vehicles
Takumi Ueno, Hugo Pousseur, Binh Minh Nguyen, Alessandro Victorino, Hiroshi Fujimoto
IEEE/ASME AIM 2023
[Access PDF]