Overview
In robotics and system development, having a clear and flexible interface to visualize system states, sensor data, and real-time metrics is important. This project offers a lightweight dashboard framework designed for ROS 2, allowing quick creation of dashboards through simple configuration files.
The Video 1: Demo video of the dashboard overlaid on video. shows a demo of the dashboard running over a video stream.
Motivation
Tools like RViz2 or rqt provide some visualization but often lack flexibility for custom layouts, post-processing, or presentation-ready dashboards. This framework aims to:
- Quickly prototype custom UI dashboards for ROS 2 nodes
- Support both live systems and offline analysis with rosbag files
- Enable video export for presentations or analysis
Approach
The dashboard layout is defined using a YAML configuration file, inspired by tools like Qt Designer but tailored for ROS 2 environments.
This YAML system allows users to:
- Define widgets and their properties
- Specify the ROS 2 topics to subscribe to
- Customize appearance and data bindings
- Choose rendering on a solid color or video stream background
This method removes repetitive UI coding while offering high customization.

The Fig. 1 shows an example how to create a component compatible with your topic. Steps:
- First, need to create a class heriting from a basic abstract component;
- Second, define the callback function allowing to update the value to show;
- Finally, edit the config file and call the new class in the component type.
Widget Support
The supported widgets include:
- Slider: adjustable control linked to a ROS topic or parameter
- Label: dynamic text or numeric display
- Map: static image or live video background with data overlays
- Circle: simple shape for markers or indicators
- Plot: real-time graphing of numeric data
Widgets are composable and layouts are defined via configuration without hardcoded UI logic.
Usage Modes
The dashboard operates mainly in two modes:
Online Mode
Connected to a live ROS 2 system:
- Visualize sensor data and system status in real-time
- Interact with running nodes (e.g., adjust sliders)
Offline Mode
Replay dashboards from recorded rosbag files:
- Useful for post-analysis, testing, and debugging
- Rebuild system behavior over time in a clean UI
- Export images or videos
Video Export
The framework supports exporting visualizations as video, with or without transparency, enabling easy integration into presentations or post-production workflows.
Examples
Here are some dashboard examples showcasing different configurations and visual styles:
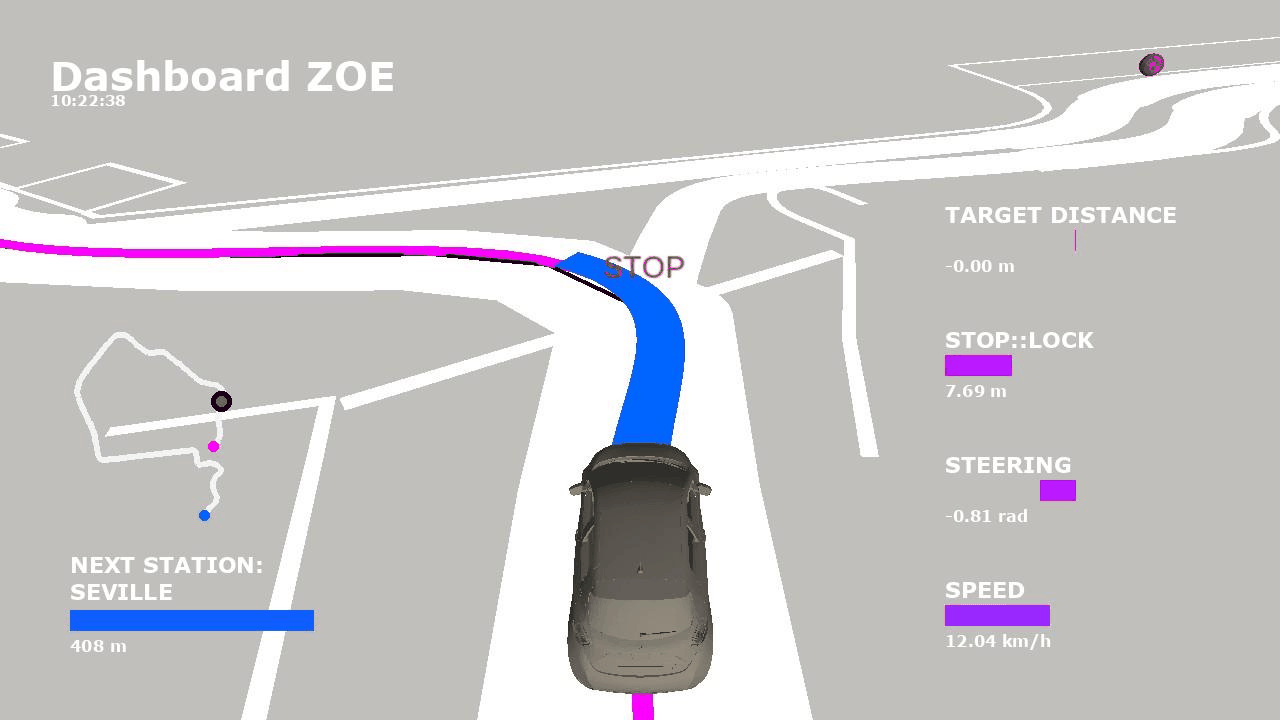
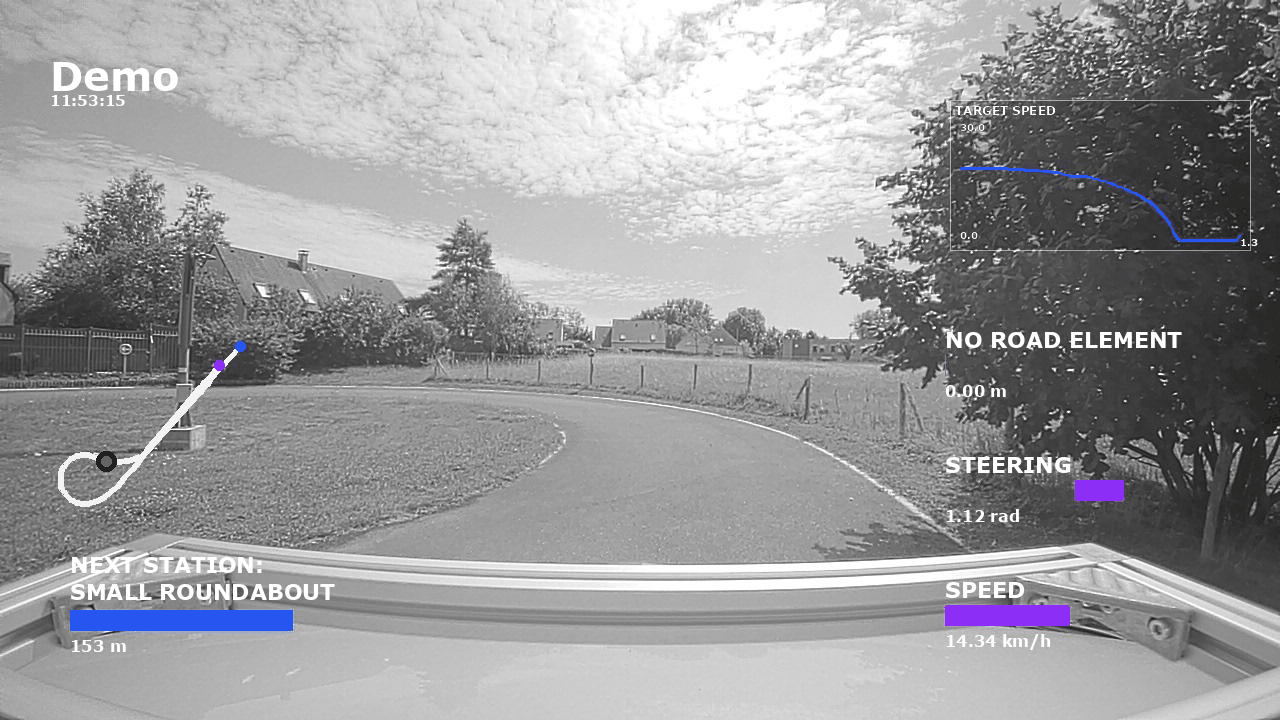
The Fig. 2 illustrates different dashboard configurations, one using an Rviz image and the other a camera image background.